The Retention Curve: If Yours Never Flattens, You Are Renting Users
Ask a founder how retention is doing and you will usually get a single number back. Day one was 60%, Week one holds at 40%. Whatever it is, it comes out as one figure, dropped into a deck, nodded at and moved past. But one figure cannot tell you the thing you actually need to know, which is whether people stick around once the novelty wears off. For that you need the whole timeline. You need the retention curve.
What the retention curve actually shows
A retention curve is simple to plot: Take a group of users who all signed up around the same time, then track what share of them are still active one day later, seven days later, thirty, ninety. The vertical axis is the percentage still coming back. The horizontal axis is time since they joined. That is the whole chart.
What makes it more honest than almost any single metric is that it refuses to average the drop-off away. A churn percentage or a monthly active count gives you one number for a messy reality. The curve shows you the reality itself, the exact slope of people leaving, and where that slope finally settles down, if it ever does.
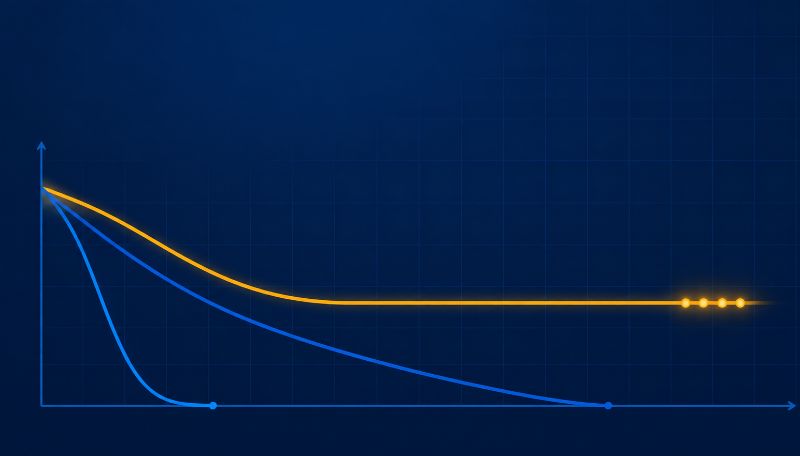
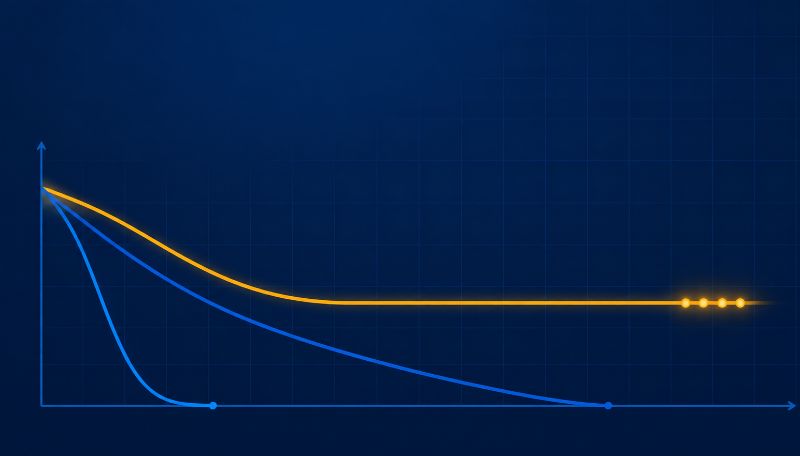
Three curves, three very different futures
Draw enough of these and you start to see the same three shapes.
The first is the cliff. It can start high, then it slides toward the baseline and keeps going. People try the product, drift off, and almost nobody is left a month later. It is the most common shape for a young product, and it is fatal if it never changes, because you are pouring new users into the top of something with no bottom.
The second is the slow bleed. A gentler slope, less alarming at a glance, often mistaken for health. But it is still pointed down, and given enough time it ends in the same place as the cliff. It just takes longer and feels less urgent, which is its own kind of danger.
The third is the one you want. It drops at the start, because some of the people who signed up were never a real fit, and then it levels off into a flat line that holds. That flat tail is a group of people who found genuine, repeated value and are not going anywhere. The percentage might not be huge. The point is that it stopped falling.
Most product people treat that flattening tail as the clearest read on product-market fit you can get from behaviour data. Not because the number is high, but because the line stops sliding. A product that reaches a flat tail has found a set of people for whom it is useful week after week. A curve that never flattens has not, however good the launch looked.
A flat tail is the most honest thing in your whole analytics setup. You can talk yourself into almost any other metric. You can admire a big signup week, a shiny activation rate, a conversion number that ticked up. But a retention curve that keeps falling toward zero is telling you something no story can cover up, which is that people are leaving as fast as you can bring them in. When that tail finally goes flat, even if it flattens lower than you hoped, that is the first real proof that you built something people actually keep. Everything before that point is just traffic.," Ian Naylor, Founder of SaaSToolkit.
Why the day-one number lies
A big day-one or day-seven figure feels like success, and frequently it is not. You can buy a great early number with a slick onboarding flow, a launch spike, a discount, or a burst of curiosity that has nothing to do with whether the product is good. None of it tells you who is still there in month three.
The headline churn percentage everyone reports has the same blind spot. It is a single snapshot, and a snapshot flatters you by hiding when and where people actually leave. The curve shows the leaving as it happens, across the whole lifespan of a cohort, which is exactly why it is so much harder to game. You cannot hide a falling tail behind a good month.
And the shape is worth obsessing over because the economics are brutal. Bain and Company's long-cited research found that increasing customer retention by just 5% can lift profits anywhere from 25% to 95%. A curve that flattens a few points higher is not a rounding error. It compounds, year after year, into a completely different company.
A blended curve can still fool you
Here is the trap that catches teams who have started looking at the curve but only draw one. A single company-wide line blends every cohort together, and the blend can look reassuringly flat while the truth underneath is anything but. Your newest users might be bleeding out while a loyal older group holds the average up. You would never know from the one line.
The fix is to stop averaging everyone into a single curve and split the curve by cohort, so each group's real shape shows. Then you can see whether the product is genuinely getting stickier as you improve it, or whether last year's users are the only thing keeping this quarter's number alive. One is a healthy business. The other is a slow-motion problem wearing a calm face.
I always tell teams to stop staring at the front of the curve and start watching the tail," says Sofia Wright, a product retention consultant. "Everyone fixates on day one because it moves fast and it feels controllable. But day one mostly measures your marketing and your onboarding polish. The tail measures your product. If the line is still drifting downward at month six, a better welcome email is not going to save you, because the people who left did not leave on day one. They left in week three when the thing stopped being useful. Fix the tail and the whole business changes. Fix day one and you have a prettier chart that ends in the same place.
What to do when your curve will not flatten
The flattening point is usually decided early, in the first session or the first week, at the moment a user either reaches something genuinely useful or does not. So when your tail keeps sliding, the fix is rarely a loyalty campaign in month six. It lives upstream.
Find the behaviour that the people who stick actually share in their first few days. The one action, or the small set of actions, that separates the flat-tail cohort from the cliff cohort. Then get more of your new users to that moment, faster, and watch whether the curve responds. If the tail lifts, you found the lever. If it does not, you found something that felt important but was not. Retention work that never moves the shape of the curve is just activity dressed up as progress.
"When a team asks me what their retention should be, I tell them the only benchmark that matters is their own curve from last quarter," says Becky Halls, Strategist at SaaSToolkit. "People want a magic number to hit, and there isn't one, because a note-taking app and a payroll tool live in completely different worlds. What you are looking for is not a specific height. It is a tail that is flatter than it was, and a flattening point that arrives sooner than it used to. That is the product getting better in the only way that actually shows up in the bank. Chase someone else's benchmark and you will spend a quarter feeling bad about a number that was never meant to describe you."
The spread really is that wide, which is why comparing against strangers is a waste of time. Mixpanel's 2026 benchmarks put weekly retention for B2B products anywhere from 44.6% to 77.9% depending on the product. There is no universal "good" line hiding in there. There is only the question of whether yours is holding better this quarter than last.
You cannot improve a shape you cannot see clearly, and most teams cannot see it clearly, because the behaviour that decides the curve lives in one tool and the retention chart lives in another. Put the two in the same place and the curve stops being a quarterly autopsy and becomes something you can actually steer while it still matters. Watch the tail. If it flattens, you have something real to build on. If it never does, no growth tactic will rescue it, because you are filling a bucket that was never going to hold water.
FAQ
What is a retention curve? It is a chart showing what percentage of a group of users who signed up around the same time are still active over the days, weeks, and months afterward. The vertical axis is the share still coming back, the horizontal axis is time since signup. Unlike a single churn number, it shows the full pattern of who leaves and when, and whether the drop-off ever levels off.
What does a flattening retention curve mean? A curve that drops at first and then levels into a flat tail means you have a core group of users who found lasting value and keep coming back. That flat line is widely treated as one of the clearest signals of product-market fit, because it shows people stop leaving rather than drifting toward zero. The height of the flat part matters less than the fact that it flattened at all.
Is a high day-one retention number good? Not on its own. A strong day-one or day-seven number can come from good onboarding, a launch spike, or simple curiosity, none of which proves people will still be around in month three. The shape of the whole curve, especially whether the tail flattens, tells you far more than any early figure.
How is a retention curve different from churn rate? Churn rate is a single snapshot, usually one number for one period, and it can hide exactly when and where users leave. A retention curve shows the leaving as it unfolds across a cohort's whole lifespan, so it is much harder to flatter yourself with. The curve is the full story; the churn rate is one frame from it.
What is a good retention curve for SaaS? There is no universal number. Benchmarks vary enormously by product type, with weekly B2B retention reported anywhere from the mid-40s to the high-70s in percentage terms. The most useful comparison is not someone else's average but your own curve over time: a tail that is flatter than last quarter, and a flattening point that arrives sooner, is the real sign of progress.
How does SaaSToolkit help with the retention curve? SaaSToolkit captures what every user does from one JavaScript snippet, so your retention curves and the behaviour that shapes them sit in the same place. You can split curves by cohort, see which early actions separate the users who stick from the ones who leave, and watch whether a change actually moves the tail, rather than piecing it together across separate tools after the fact.